SDR e Applicazioni GNU radio
The expansion of new communication methods led to the develop of software-defined radio (aka SDR) technology that permit to adapt radio systems without perform physically changes on the hardware. SDR forum, in collaboration with Institute and Electronic Engineers define SDR as “Radio in which some or all of the physical layer functions are software defined”.
Traditionally a hardware radio device does not permit or have limits on cross-functionality. SDR provides a combination of hardware and software technology through which the radio operative functions, refer as processing physical layer, are software implemented within integrated elements as FPGA, DSP and SoC.
Primary benefits are:
- Different wireless communications methods implemented in a common platform architecture;
- Development flessibility for upgrade and new functions integration;
- Providing to end-users the access to ubiquitous wireless communication system at low cost;
- Costs reduction.
GNURadio is free open-source software that provide signal processing tools for implement radio systems. It can be used in association with hardware interfaces (ex. USRP di Ettus Research) or in totally simulative environment.
DWave make use of GNURadio for research and development of new terrestrial and satellite radio communication systems. Hereafter we will show a couple of applications for costumers.

1. UpChirp Modulated Packet Detection Algorithm Simulation
The scope of this application is the implement of a chirp modulated packets detection algorithm and study its performance over very low SNR ratio. The implementation is total simulative and figure 1.1 shows a generated packet preamble made with eight consecutive upchirps plus AWGN noise.
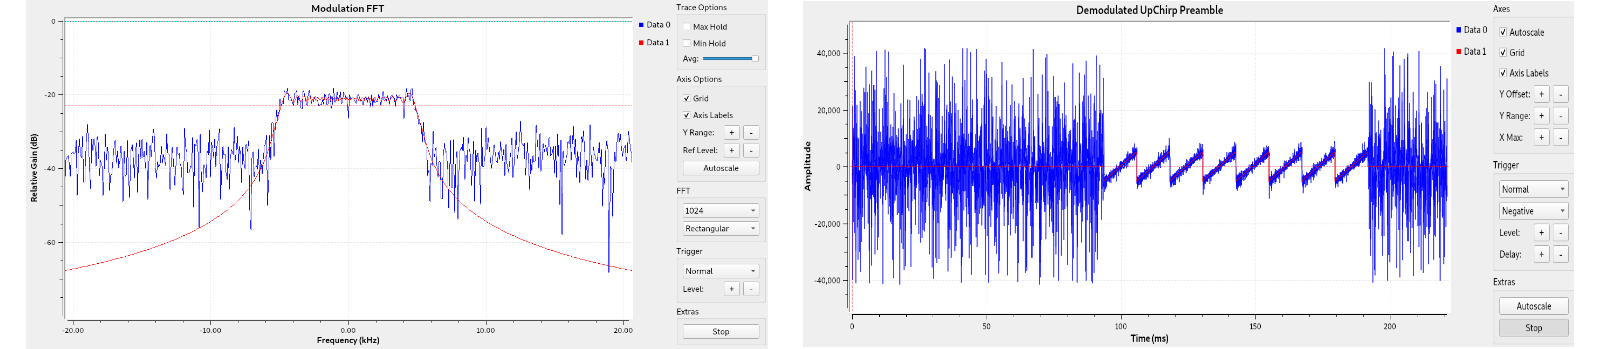
Fig. 1.1: FFT and Time Scope of generated upchirp packet in GNURadio.
For the model validation, a LoRa packet generated by a SX126aDVK board was captured with Ettus USRP N210. Figure 1.2 shows the typical LoRa packet structure made with preamble, sync and downchirp.
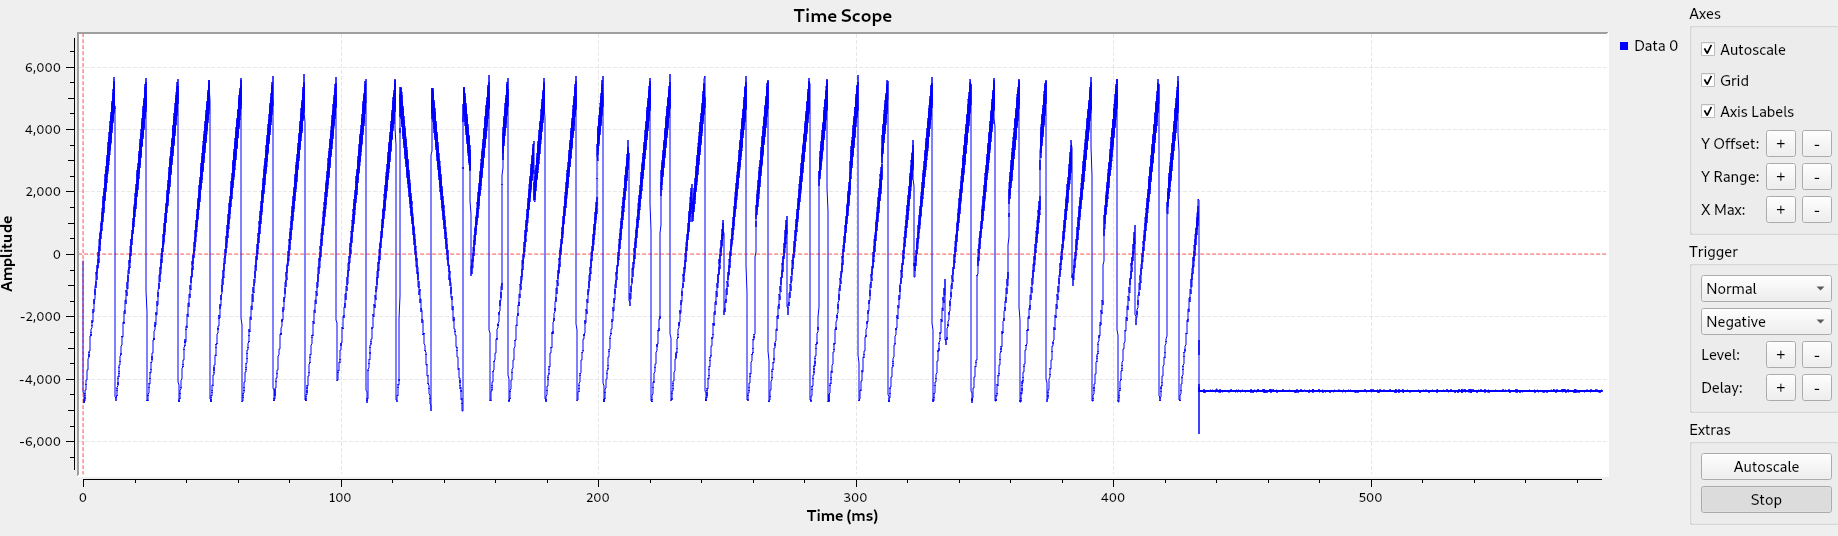
Fig. 1.2: LoRa Up-Dow Chirp used as validation test
The flowgraph of detection algorithm is shown in figure 1.3. The ‘OOT’ block named “Detection Algorithm” implement our model that is also been extended in a polyphase structure for performance improvement in certain conditions of frequency and symbol time offset.
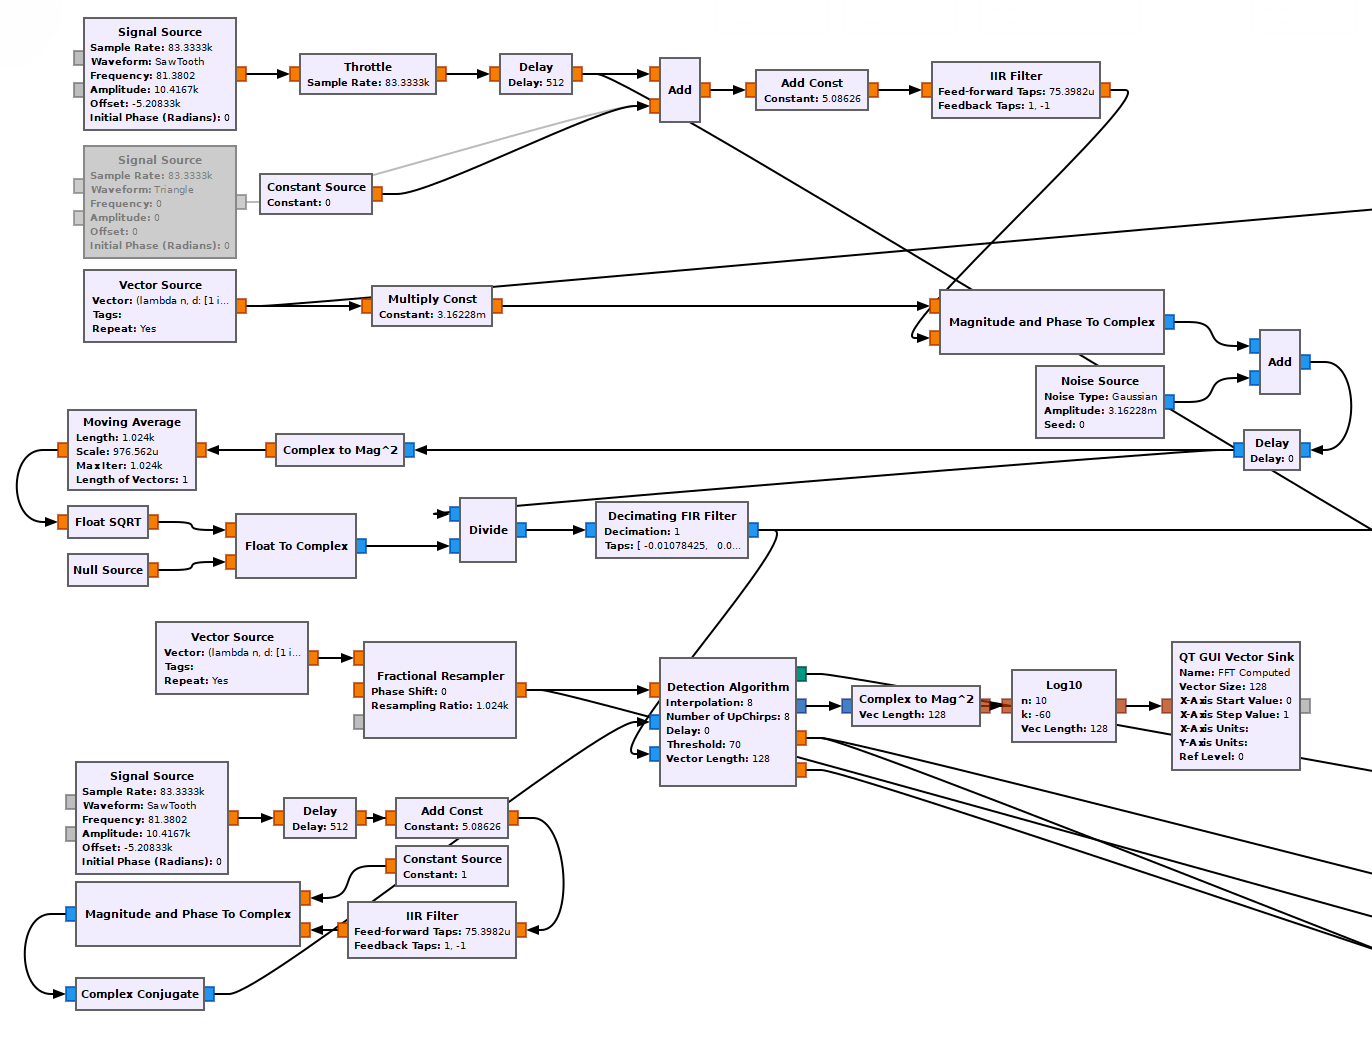
Fig. 1.3: GNURadio flowgraph for detection algorithm.
The algorithm output is shown in figure 1.4 within a SNR value of -13 dBm. The blue curve represents the time window through which the signal energy is measured and compared with a predetermined threshold. Red curve represents the convolution of ‘Threshold’ block response with a rectangular filter. Detections occur when red curve is higher than 0 at the blue curve negative ramp. Signals that exceed the threshold after the time window are false detections (see fig. 1.4, right red dots under cyan curve).
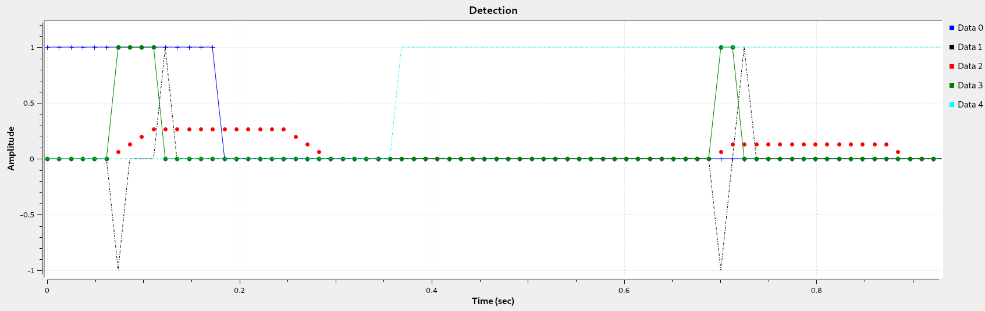
Fig. 1.4: Detection algorithm output
The performance of the model is analyzed by iterating the algorithm over certain number of packets. Figure 1.5 show results also with carrier frequency offset (CFO) and symbol time offset (STO) effects.
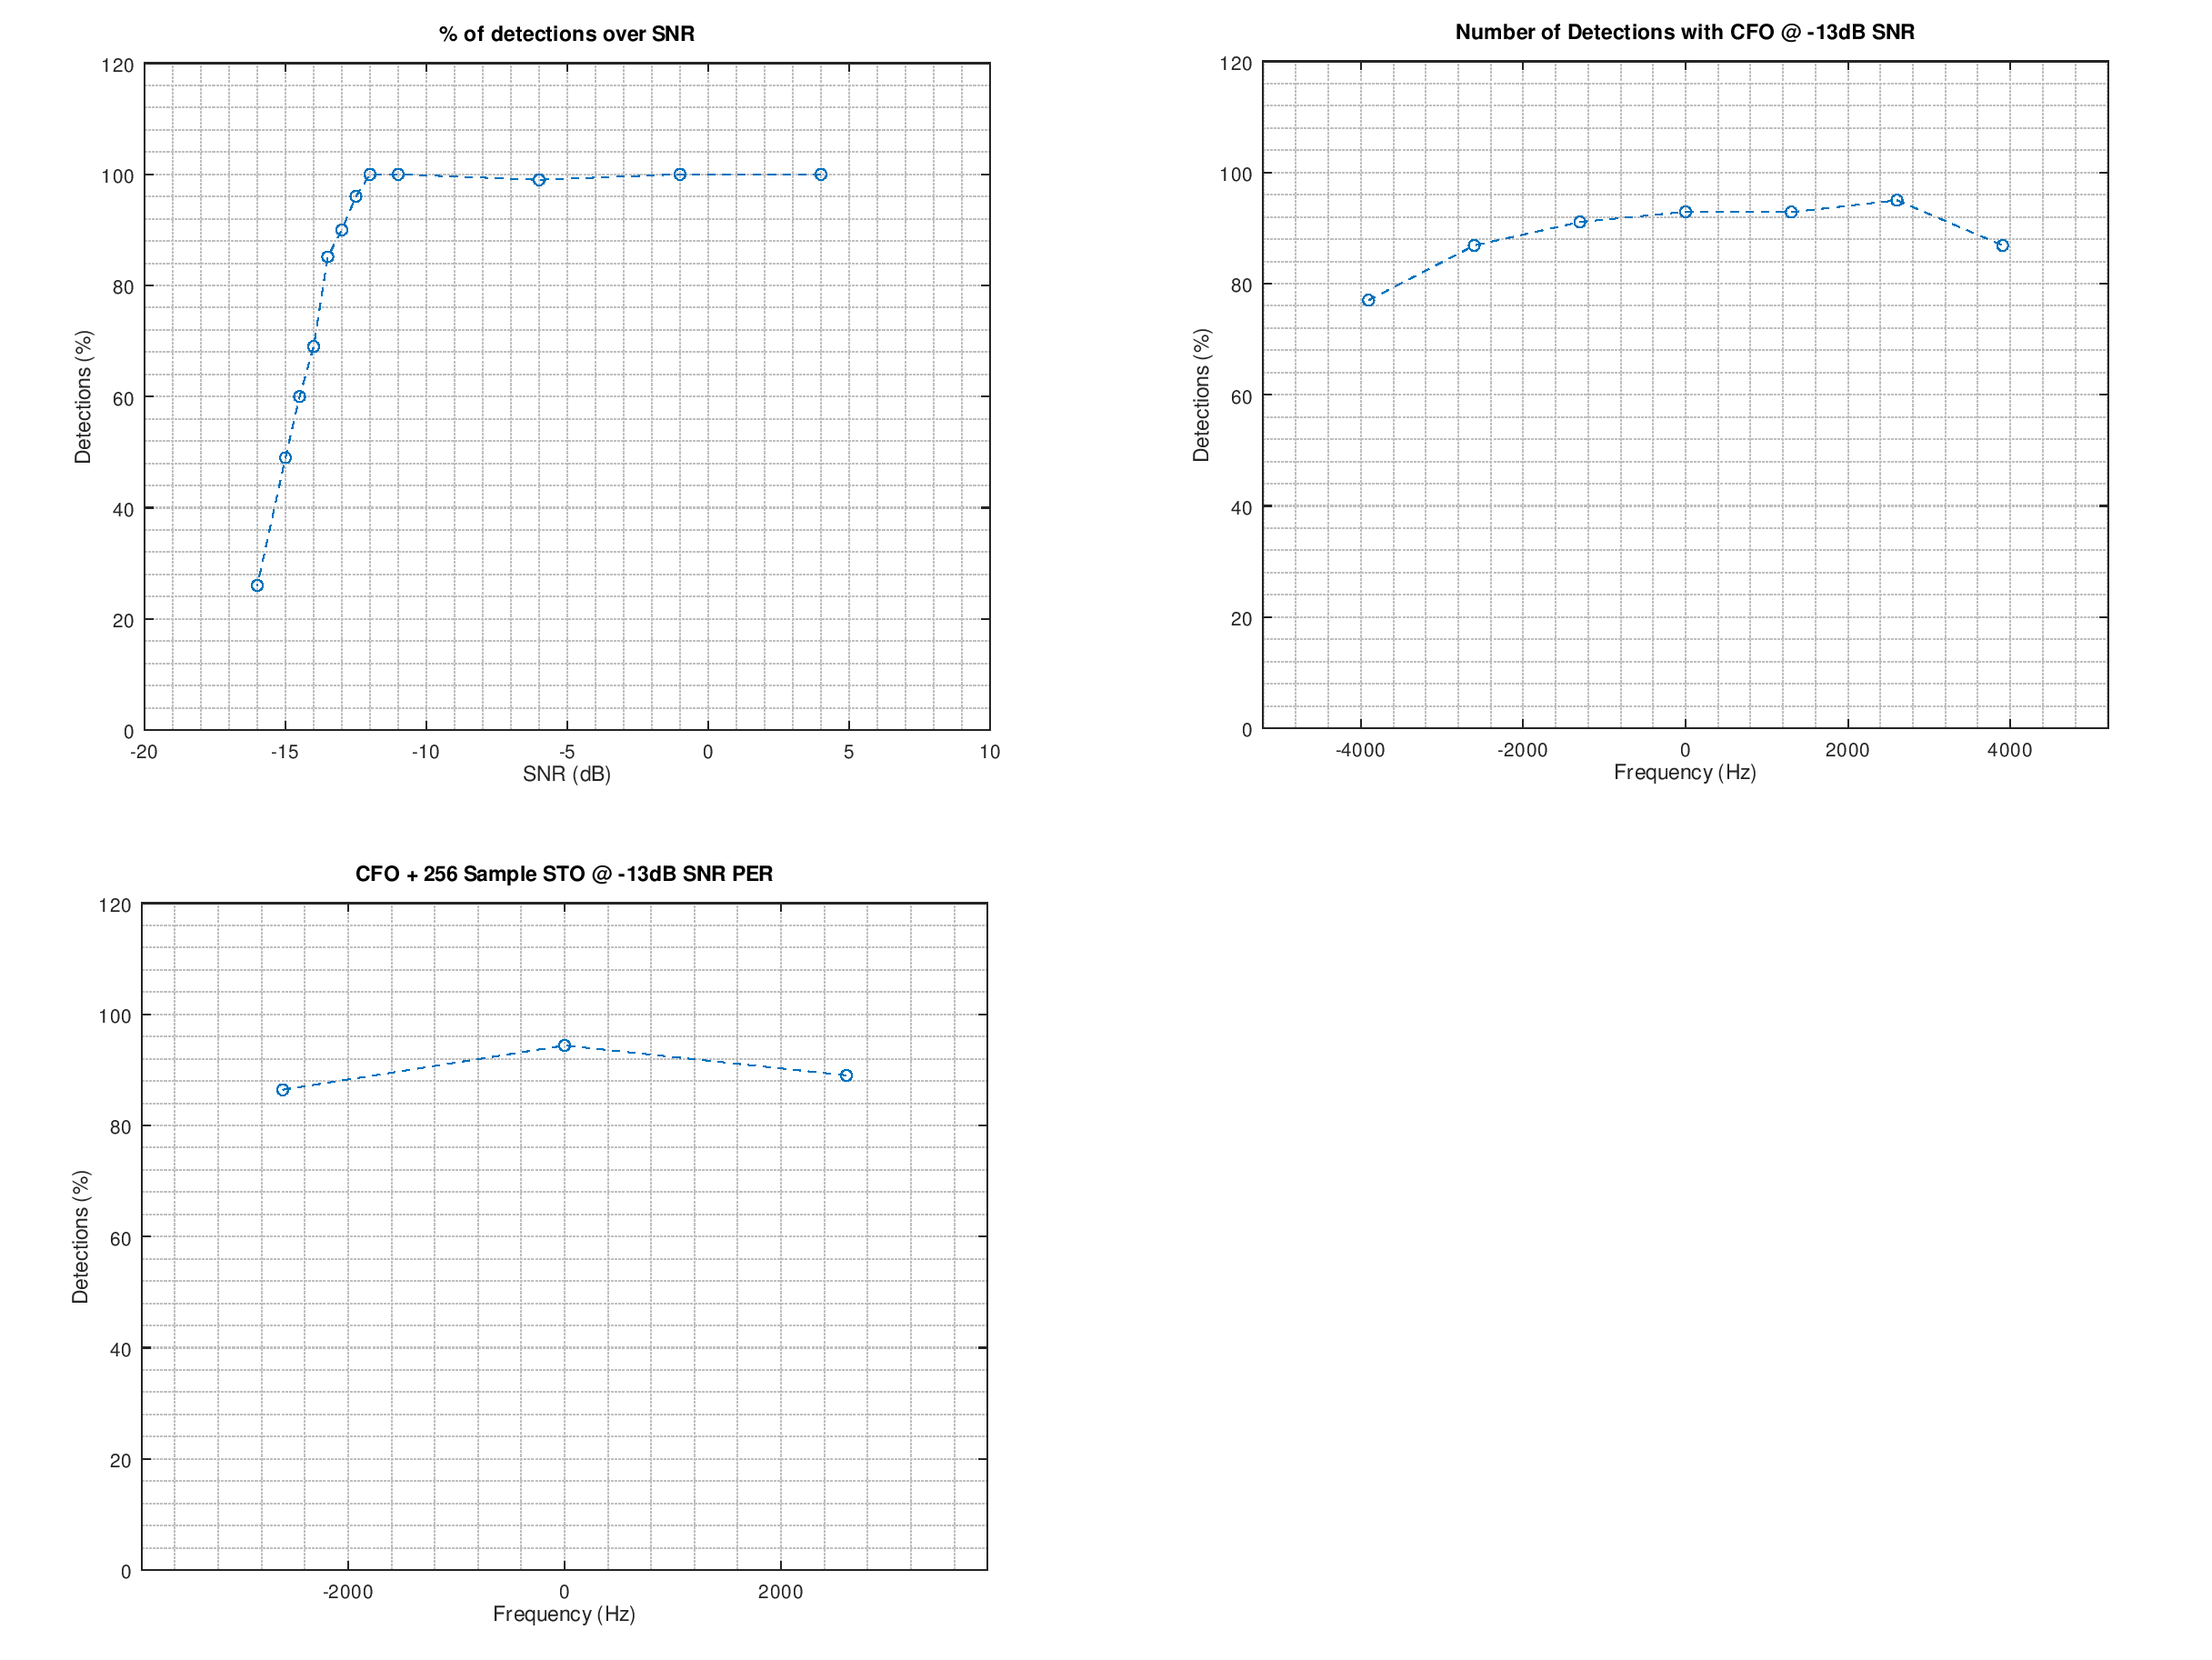
Fig. 1.5: Detection algorithm results. Up-left: percent of detections over SNR. Up-right: percent of detections over frequency with CFO effect. Down-left: percent of detections with CFO+STO effect within polyphase architecture algorithm.
2. Doppler Effect Compensation Analysis of Semtech SX1261x transceiver
The purpose of this analysis is to characterize Semtech SX1261x LoRa transceiver for a certain application. We wanted to estimate the capability to compensate the dynamic variation of signal frequency offset, typically caused by doppler effect.
We used GNURadio and Ettus USRP N210 for collect data and perform an offline elaboration by introducing frequency variation following a predetermined curve that represents doppler rate. Modified data are retransmitted and we performed a statistical analysis of the number of received packets under certain low SNR conditions.
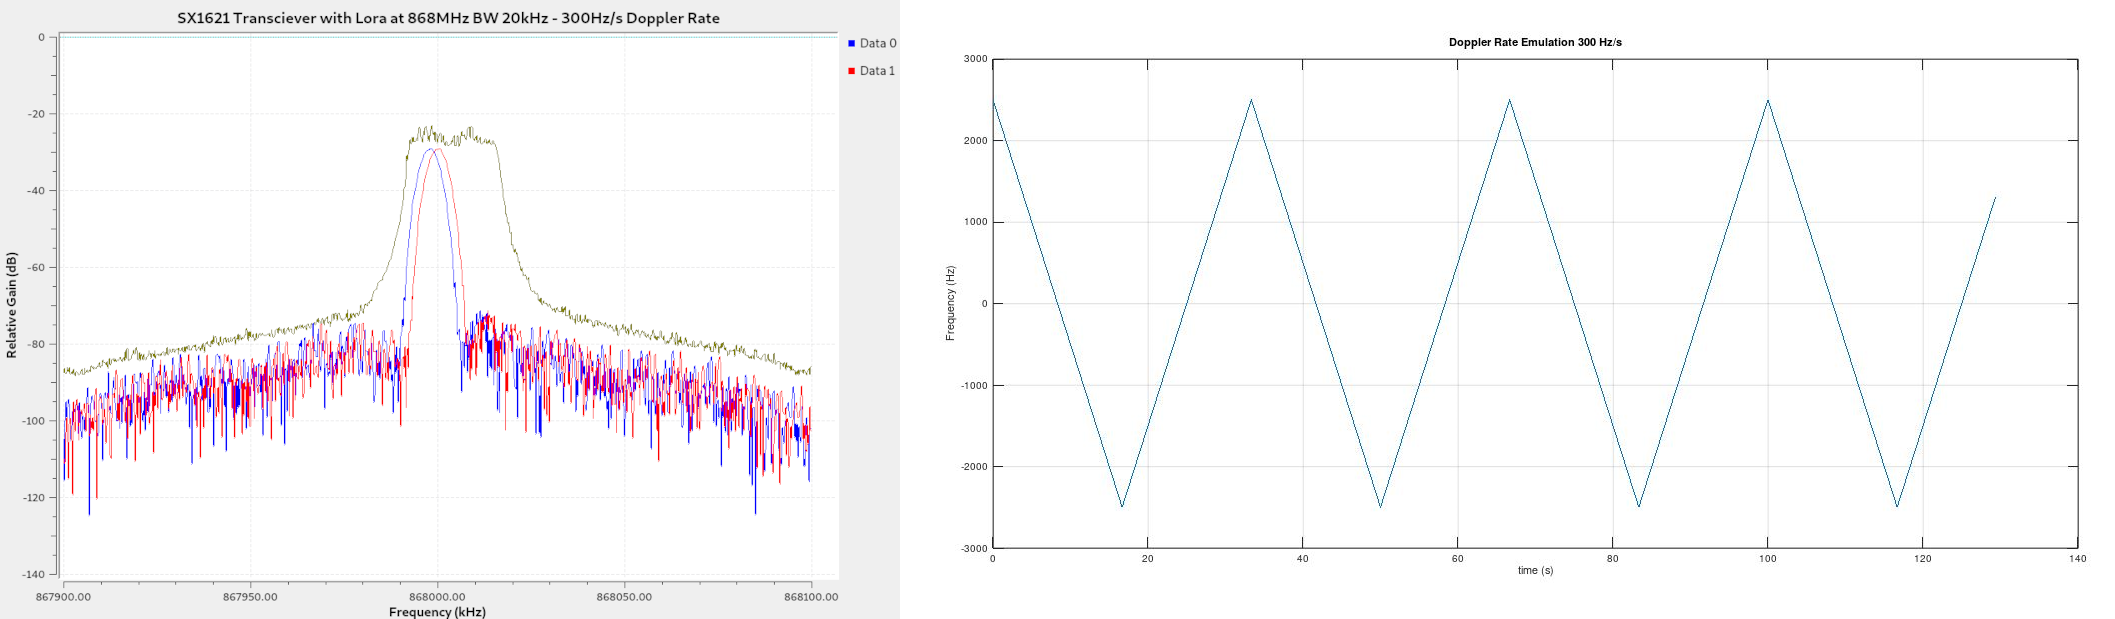
Fig. 2.1: Doppler effect emulation screenshot. Left picture: red signal is original data while blue signal the data with offset. Yellow curve shows the max hold. The maximum deviation of 5kHz from left to the right due to emulated doppler effect can be appreciated. Right picture: doppler rate curve applied to collected data.